When analysts talk about return on networth / equity, they are asking a simple question: for every rupee, dollar or pound that shareholders have put into a business, how much profit does the company make in a year? In some countries, especially India, the term “return on net worth” (RONW) is used interchangeably with return on equity (ROE). Here is a clear explanation with an example.
The basic definition
Return on net worth tells you how efficiently a company turns shareholders’ funds into profit. It is expressed as a percentage. A higher figure generally suggests the business is generating more profit from each unit of capital, though context always matters.
Return on networth / equity: the formula
Return on networth / equity equals net profit after tax divided by shareholders’ equity, multiplied by 100. Net worth for a company means shareholders’ equity: share capital plus reserves and retained earnings, less accumulated losses. Many analysts use the average of opening and closing equity for the year, which smooths out changes.
A worked example
Suppose a company reports net profit after tax of 12 million, and shareholders’ equity was 80 million at the start of the year and 100 million at the end. The average equity is 90 million. Return on net worth is 12 divided by 90, which is about 13.3 percent. If the company then reports 15 million profit on 110 million average equity the following year, the ratio is about 13.6 percent, showing a slight improvement.
What counts as a good return?
There is no universal benchmark. Many investors consider 15 percent or more attractive for stable businesses, but returns vary by industry. Software firms with few physical assets often report higher ratios than utilities or banks. Comparing a company with its own history and with close competitors tells you more than comparing it with a fixed number.
Why the number can mislead
- Debt inflates it. A company that borrows heavily has less equity, so the same profit looks like a higher return. Check debt levels alongside the ratio.
- Buybacks shrink equity. Repurchasing shares can raise the ratio without any change in the business.
- One-off gains. A profit from selling an asset can distort a single year.
- Negative equity. If a company has accumulated large losses, the ratio can be meaningless.
Related measures
Return on assets
This divides profit by total assets, including borrowed money, and is less affected by debt.
Return on capital employed
This looks at profit before interest relative to equity plus debt, which helps compare companies with different financing.
DuPont analysis
It breaks return on equity into profit margin, asset turnover and financial leverage, showing where the return really comes from.
Using it as an investor
Look at several years of figures, check whether growth is driven by profit or by leverage, and compare with peers. No single ratio makes an investment decision. Our guide on how to calculate your networth covers the personal version of net worth, and our overview of what networth is used for shows other business uses.
Quick questions readers ask
Is RONW the same as ROE? Mostly yes; the names are used interchangeably. Can it be negative? Yes, if the company makes a loss. Where do I find the inputs? In the annual report.
An example from the real world
Consider two retailers. One reports a 25 percent return on equity but carries large borrowings; the other reports 14 percent with almost no debt. The first looks better at a glance, but it is also more vulnerable if sales fall or interest rates rise. An analyst would examine the interest cover and the trend in profit before choosing. In practice, steady, moderate returns with low debt are often considered healthier than very high returns that depend on borrowing. Looking at several ratios together gives a more reliable picture of the company’s quality than any single number.
In short
Return on networth / equity measures profit relative to shareholders’ funds. It is useful for comparing companies and tracking progress, as long as you also check debt and the quality of earnings.
This article is educational and not investment advice.
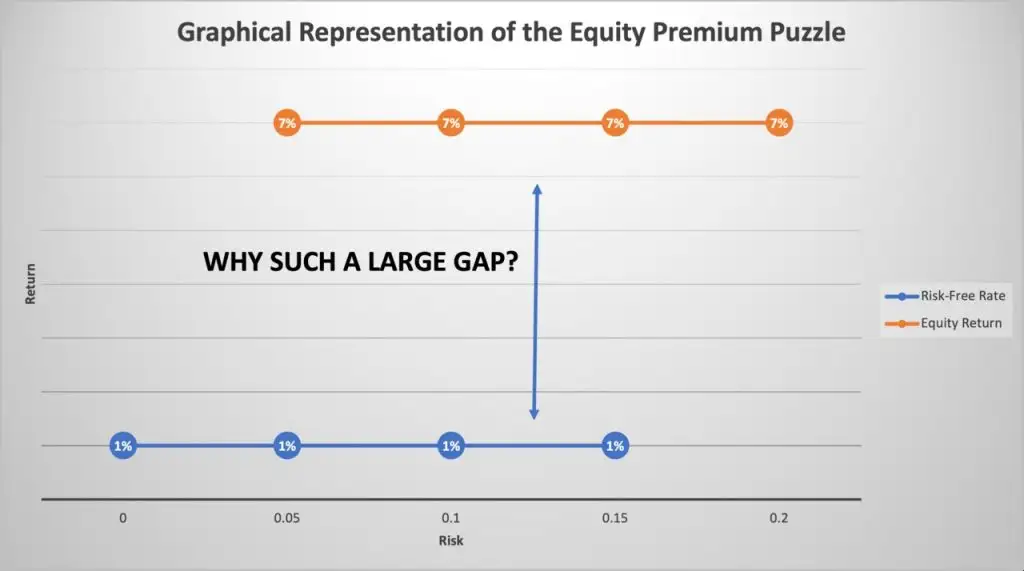
Featured image: Equity Premium Graph.png by Unkindnesseconomics, CC BY-SA 4.0, via Wikimedia Commons.